4. How to Read a Machine Learning Research Paper Efficiently
June 28, 2024

In this practical work, we’ll be learning How to Read a Machine Learning Paper Efficiently.
Let’s Get Started
Abstract
As someone studying machine learning, you’ll have to read technical papers at several points in your life to review the current literature on specific topics you want to research. You’ve actually already come across several papers while doing the previous practical works.
Doing a literature review is essential when starting to work on a subject: People have probably already looked into the topic you want to study, so learning from their previous work will help you save time and reach a solution faster.
However, reading papers in ML is not always simple, since ML is a complex field applied to many different domains, you’ll have to have previous knowledge of mathematics to understand the formulas, you’ll need to have a background in programming to be able to implement the paper (ML is literally Machine Learning) and on top of all that, you might need to learn some of the specifics of the field your paper is being applied to: e.g. It could be an ML paper applied to the medical field (e.g. The U-Net foundational architecture was introduced in a Biomedical paper) or to finance.
Also, reading a paper can take you time at the beginning since you’ll be lacking many of the concepts and tools to reading them efficiently, so don’t give up, you’ll get there!
In this practical work, you’ll learn how to read a paper fast and get the important information that’ll help you.
Introduction
As we’ve said, reading a paper isn’t always simple business, but it becomes easier the more papers you read. On top of that, at the beginning you’ll be lost at what to look for in a paper, how to read it and what you should expect from it. To help you at the beginning, think that when reading a paper you’ll need to have a goal in mind and you should be able to answer some questions about the topic you’re trying to learn about.
Let’s discuss a few of these questions!
Where’s the research currently at on the topic?
Some topics can be cutting edge and can still be in early research, for example, explainability of language models is a field that has a few years and while a lot of research is currently being done, no real “fits all” solution actually exists because it’s a very hard problem to solve: Why did a model output this specific answer?
What are the challenges typically encountered?
Each sub-field of machine learning has its own challenges: For example, for a while in language modeling and generation (GPT-like models), the challenge was to get a model that would output something coherent for more than one sentence. Early research was only able to output one sentence at best and the follow-up sentences would make no sense or be random even if they syntaxically made sense. Nowadays, there are other problematics of making language models generate answers much faster and using less memory.
In summary, after reading a few papers on your topic, you need to be able to get a better understanding of current challenges that need to be solved.
What are the best solutions available?
In a paper, you’ll typically find a few paragraph towards the beginning of the paper (In sections like Background or even in the Introduction) that will summarize the current state of the field and what the research themselves have looked into before doing this research. In this part, they’ll explain what are/were the current best methods and what their methods is improving on top of the others. This is also a good opportunity to read about these competing methods they mention.
On top of that, you’ll typically find benchmarks in the middle or towards the end of the paper against other methods they’ve tried. Typically the paper will show improved results, but be wary that sometimes you can make numbers say what you want ;)
Is there any usable code in the paper?
Something you should look for is: Is there any available code or even a usable product (e.g. a tool, framework, library, etc) out of this research paper?
This will definitely simplify your life if you’re looking to use a method quickly instead of having to reimplement it. Make sure to look at the license of the code, depending on what you want to do with it (e.g. commercial usage, etc) you might run into some blockers.
What are the limitations of the current solutions and what could be improved in the future?
When you’re reading a paper, the paper never fully solves a problem and then marks the end of the current field of research. There are always limitations or things to improve that you’ll need to spot because it might not always be explicitely stated.
Often, these limitations can be discussed towards the end of the paper or in the conclusion itself. So be sure to look for this. Also, sometimes the researchers won’t mention these limitations or haven’t yet found them.
Types of papers
Now that you finally know what to ask yourself when reading a paper, you also need to choose the actual paper you want to read. For that you’ll need to know that there a several types of papers that can have different layouts, lengths and types of things they discuss. Here are a few of them:
Papers Introducing a New Method
These papers will usually be either a breakthrough new architecture or a novel way of doing something that already exists.
Examples:
- YOLO for fast object detection
- Transformer architecture for more accurate language modeling
- Vision Transformer (ViT), as its name implies, applies the Transformer architecture but to Computer Vision tasks. An alternative to Convolutional Neural Networks (CNNs).
- Retentive Network, which is a different way of doing language modeling and tries to be a successor of the Transformer (yet remains to be seen in practice)
Papers Showing Incremental Improvements
Research always works in incremental improvements, even if we see breakthrough methods here and there, they often build upon a long list of incremental improvements.
Examples of improvements on YOLO:
- YOLO9000, YOLOv3, YOLOv4, yes they skipped v5’s paper, YOLOv6, YOLOv7, YOLOv8 paper is not yet ready, YOLOX, PP-YOLOE and more!
Papers Introducing a New Framework
Frameworks like PyTorch or Tensorflow can seem like a common tool, but they are actually the result of state-of-the-art research on commoditizing machine learning into powerful, efficient and simple tools to use. So they have their own papers:
- PyTorch, the machine learning library we’ve been using so far.
- TensorFlow, an alternative to PyTorch.
Making a survey of a specific field
Some fields have so much research happening that even if you’re working directly in the field you can struggle of keeping track of everything. Or if you’re from a different field and want to understand the current state of the field, survey papers are quite convenient for that.
A few examples of surveys:
- Large Language Models: A Survey: Survey on the current state of Large Language Models (LLMs) from dataset creation to training to evaluation and metrics and latest trends in the field
- Deep Learning for Image Super-resolution: A Survey: Unfortunately, it can sometimes be hard to find an up to date survey paper, like this one dating from 2019 and was last updated in 2020. Methods have changed quite a lot since, but it’s still very useful to get a history on how things were just a few years ago. You can then start looking for relevant papers with a solid starting point.
Papers Introducing a Metric
Some papers introduce new metrics to better evaluate model results. This is very important because the metrics we have never show the full picture of your model’s behavior.
A few examples of papers introducing a metric:
- Fréchet Inception Distance (FID) is a metric that improves how similar generated images are to real ones.
- Focal Loss is a loss function that tries to help in the case of imbalanced data. It was introduced in the context of improving object detection methods but can actually be used in many other contexts since it is a modification of the Cross-Entropy loss.
Papers Introducing a Dataset
Other papers will introduce a dataset since the current state-of-the-art datasets have either become too easy for current models or researchers know every trick possible to get good scores on these datasets so they become less relevant. Also, there is never enough data in machine learning, and especially deep learning, as we keep scaling models, datasets will keep getting bigger with samples covering more and more cases.
Datasets are extremely important and require very careful study and collection. Many datasets, after they get published and studied heavily, turn out to have a lot of outliers, badly annotated samples or contain imbalanced classes. This is normal and the bigger datasets become the harder it becomes to check for these issues and the more automation and assumptions need to be introduced.
A few examples of papers introducing a dataset:
Papers That Break or Confirm a Common Belief
Other types of fun papers are the ones that try to contradict or confirm a common belief. Basically, anything that people take for granted and that’s always been there and that no most haven’t thought of questioning.
A fun example is the paper Attention is not Explanation followed very shortly by Attention is not not Explanation, who’s right? 😃
And More
There are also just papers that play on the hype of a specific paper name like the famous foundational paper Attention is All You Need and use it to make their title more appealing like Attention Is Not All You Need Anymore. Actually there’s a lot more, take a look at this list. You never know, maybe the content is as original as the title.
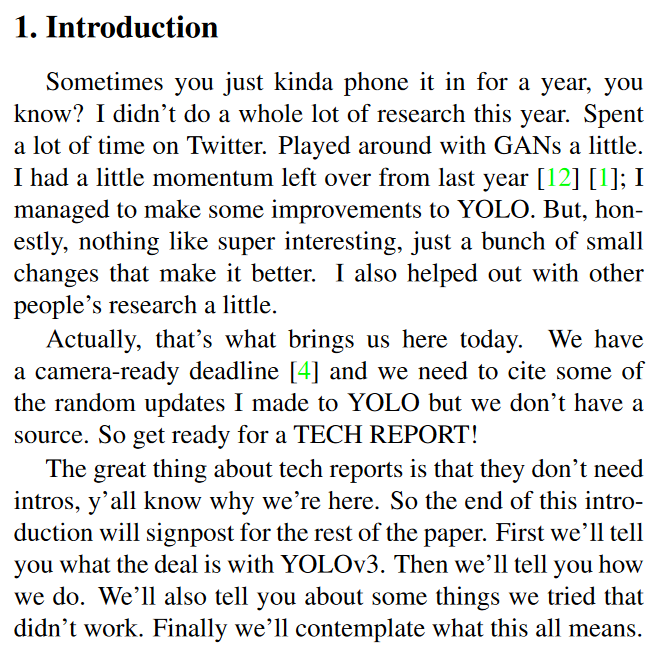
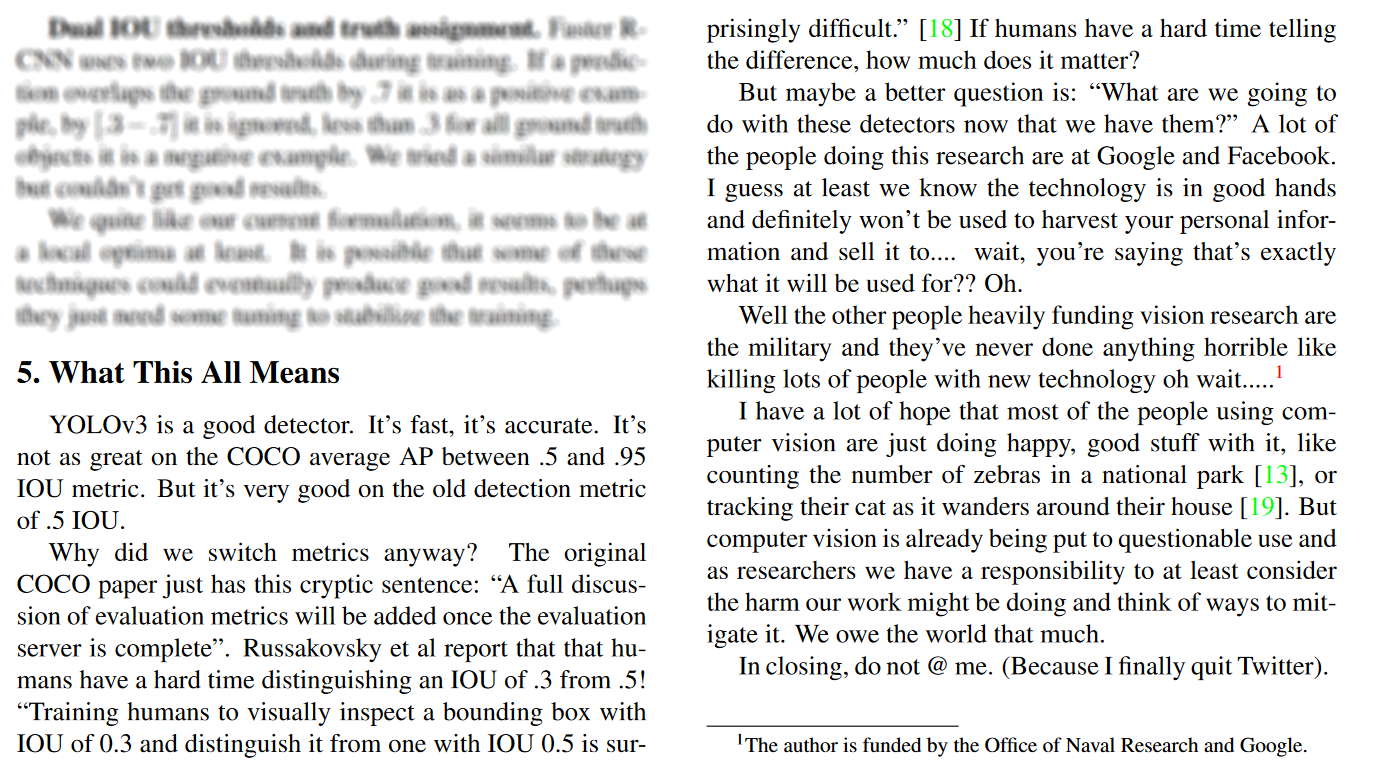
Finally, there are papers that are a bit fun, unusual or try to pass a message, for example the YOLOv3 paper: YOLOv3: An Incremental Improvement. I’ll let you read the intro and conclusion to make up your own mind…
How do we Actually Read a Paper Fast?
← Look at this example paper
You’ve already seen this paper in the previous practical works. It’s the Pixel Shuffle paper!
We’ll use the Pixel Shuffle to demonstrate how to read a paper effectively. Which you’ve already looked at from the previous practical work (in theory 😀).
The worst strategy for reading a paper is to read it linearly like a book, from first word to last word! It can seem counter-intuitive at the beginning but you’ll soon realize that papers aren’t a story to follow, but actually each part of the paper can answer multiple questions you have in the order you want.
A good way to fully understand a paper at the beginning is to first get a global view of what’s happening. You’ll also see that this will save you a lot of time in the future even when you start gaining experience reading papers because you’ll be able to spot very quickly if a paper answers the questions you have or not.
After you got good global look, then you can start diving into the details: Do the results look good enough? How did they achieve their results? And so on, until you understand the method and their results.
The methodology you’ll follow looks like this:
- First Pass: You’ll read only the Title, then the Abstract and then Figures
- Second Pass: You’ll take a look at the introduction and conclusion only
- Third Pass: Youl’ll start diving into the method, formulas, etc
- Fourth Pass: Reread until you understand and can explain yourself very simply the paper without having any questions left in your mind
In the following sections, we’ll read this paper together so you can get the feel of how to read a paper, and finally you’ll be reading a paper of your own later on to make sure you correctly got the process.
The First Pass: Title → Abstract → Figures
In the first pass of reading your paper, you’ll read it very roughly, you really want to see if it looks like it’ll be useful to you and if the results look interesting. In papers you’ll often find the abstract contains a lot of information and summarizes the paper quite well. The figures such as graphs, images or benchmark results will show you the architecture if there is a model, the results of their benchmarks, comparison with other methods and more.
The First Page: Title, (Authors) and Abstract
Let’s look at the first page of our paper to start the first pass:
1. The title: Real-Time Single Image and Video Super-Resolution Using an Efficient Sub-Pixel Convolutional Neural Network
- Real-Time: Means this model will be fast and usable in contexts where you need instant output ($\le 100$ milliseconds) from your model
- Single Image: It means it works only one image at a time. Some models use several images, it could be pictures taken less than a second apart or frames from a video. This usually helps get better quality and this what your phone does when you take a picture for example, it takes a burst and then from the small jitters caused by your hands will actually get a lot of subpixel information from all frames and use it to reconstruct a higher quality, less noisy image even in low light conditions.
- Video: This means that this paper applies super resolution on video data. We now understand why real-time is needed, since you don’t want to wait for hours to process your video.
- Super-Resolution: The process of taking a lower resolution image and reconstructing details to get a higher resolution image. This is what we did in practical work 2.
- Using an Efficient Sub-Pixel: Here we understand that this paper tries to work at the subpixel level, meaning directly either on the components of a pixel (RGB or any other color space) or on the latent representation of these components. We’ll only find out later by reading the paper, but this is only a detail for now.
- Convolutional Neural Network: The model will be based on a Convolutional Neural Network (CNN), not too surprising.
2. The people who contributed:
- You can give it a very quick glance, and where they work. Here they all work at the social media Twitter (now called X). So we know they have the budget of a tech company to make interesting research that’ll possibly be profitable to them.
- Another fact about this is that the paper is usually ordered by the authors who wrote the paper. The first author is usually the one who contributed most. Some papers also sometimes add more detail on the contributions of each person.
- If you find the paper interesting, the authors might have written other similar quality work, so it can be good to look up their name later.
3. The Abstract: This is the part where you need to focus and extract as much information as you can. Let’s decompose it:
- The beginning of the abstract explains the current context (the paper dates back from 2016) which is that a lot of innovation is happening in the usage of deep learning for single image super resolution (SISR). This means they’ll mention a few papers later on that they are improving upon. Notably, they mention that all these methods first apply a fixed upscaling algorithm on the low resolution (LR) images like bicubic interpolation before then trying to reconstruct the detail. This means these methods don’t have any tools to actually learn the high resolution (HR) patches of the new image directly, they need to artificially create the correct number of HR pixels first and then actually compute the HR details. That’s what they mean by super resolution (SR) being performerd in HR space. Finally, they say that this is suboptimal and computationally ineficient. Suboptimal because bicubic (or any other fix interpolation method) introduce a bias in your SR data and actually changes it! It could make it more blurry or add other kind of details that don’t actually exist in the SR image. As for the computational complexity, it’s because we have the interpolation method to run on top of our deep neural network which can be costly and could be avoided.
- So, we understand that the main issue is not operating in LR space directly and they introduce a method to do just that in this paper. Here their model will extract feature maps in LR space and somehow they’ll get to HR space and since most methods didn’t do it then it was a challenge at the time. The model is CNN-based and seems to be very efficient since it can process 1080p videos, which are 1920x1080, meaning 2M+ pixels are processed. We can also assume videos in a range of 20-60 FPS (Frame Per Second) since real-time can mean many things :D. They say that they achieve this on a K2 GPU which is a professional NVIDIA GPU released in 2013 based on the Kepler architecture, so it still required a good enough GPU at the time since professional cards are quite expensive.
- They now mention how the extracted LR feature maps will get upscaled into HR space: They introduce a sub-pixel convolution layer. This is important to note and this is what we’ll be trying to look for and understand in this paper since this is the main innovation they mention. This special layer removes the need to operate directly in HR space or to have to destroy features because of using a handcrafted filters because you need to get from LR to HR space at some point. This layer actually learns for each specific feature map to upscale it: This is crucial since it means that each part of the image will now have its own dedicated learned upscaling method applied to it, so all our image features should get upscaled much better and faster!
- Finally, the evaluation approach is mentioned where they use publicly available datasets on which they report better results than previous methods while being much faster. The results are $+0.15dB$ on images and $+0.39dB$ on videos, what does this mean? The $dB$ unit is actually decibels here because the metric they use is probably PSNR which is Peak Signal-to-Noise Ratio. This is a common metric expressed in decibels which quantifies the maximum amount of signal (the actual image pixels) to the noise that is affecting the quality of the image, so a higher PSNR means a better image quality because there is more signal (image pixels) than noise (blur, noise, grain or anything that degrades an image). To explain a bit more, decibels is useful here because it’s a logarithmic scale which is useful when comparing relative changes like they are doing by comparing to previous methods and it’s also closer to human perception which tends to be logarithmic in nature.
Figures
After reading through the first page which contained both the title and the abstract, we now want to look for figures.
What are figures and where can we usually find them?
Figures are just drawings, graphs, schematics, images, or anything visual really. Usually they’ll have a legend saying Figure with the number next to it. They can be found at any page. Some papers even have some before the abstract to illustrate things and make it more appealing which help readers summarize the paper better and faster if results are notable. In our case, we were able to found figures in most pages excluding the first page.
Here are all the figures and tables we can find in this paper:
![]()
As we can see, there’s a few of them and several types:
Figures
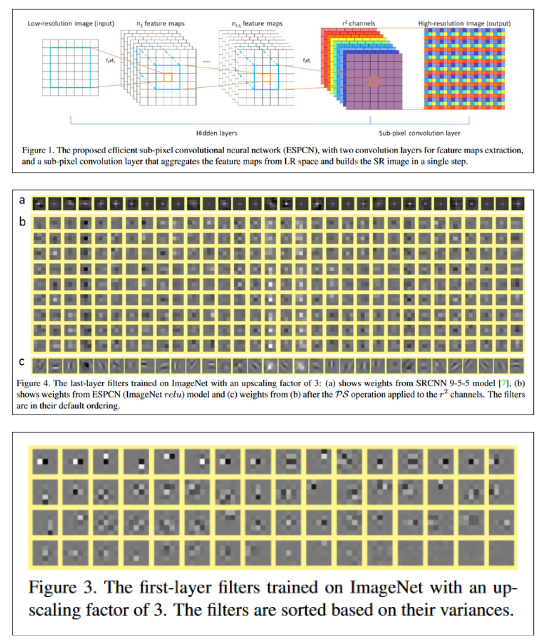
- Architecture diagrams: Figure 1 is an architecture diagram that shows how the model operates in the LR space and when we reach the sub-pixel convolution layer, we see that some reordering is being done to reconstruct the SR features maps into HR space.
- Model internals: Figures 3 and 4 show filter weights learned by the new operation they introduce. They also compare the filters with other models that solve the same task. We can see in $a$ and $c$ that filters learned by their new model seems to be of higher quality since they are more complex.
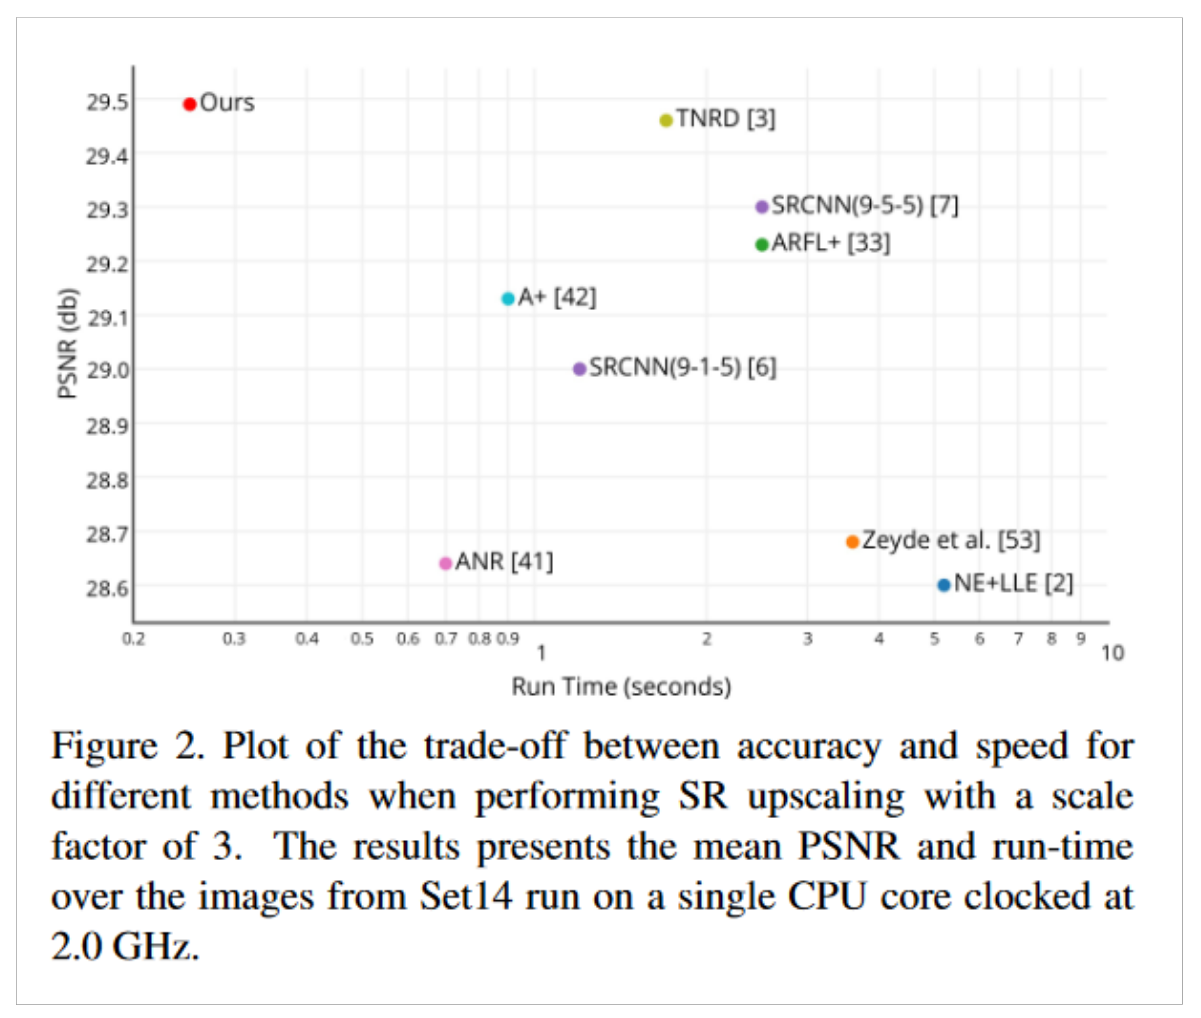
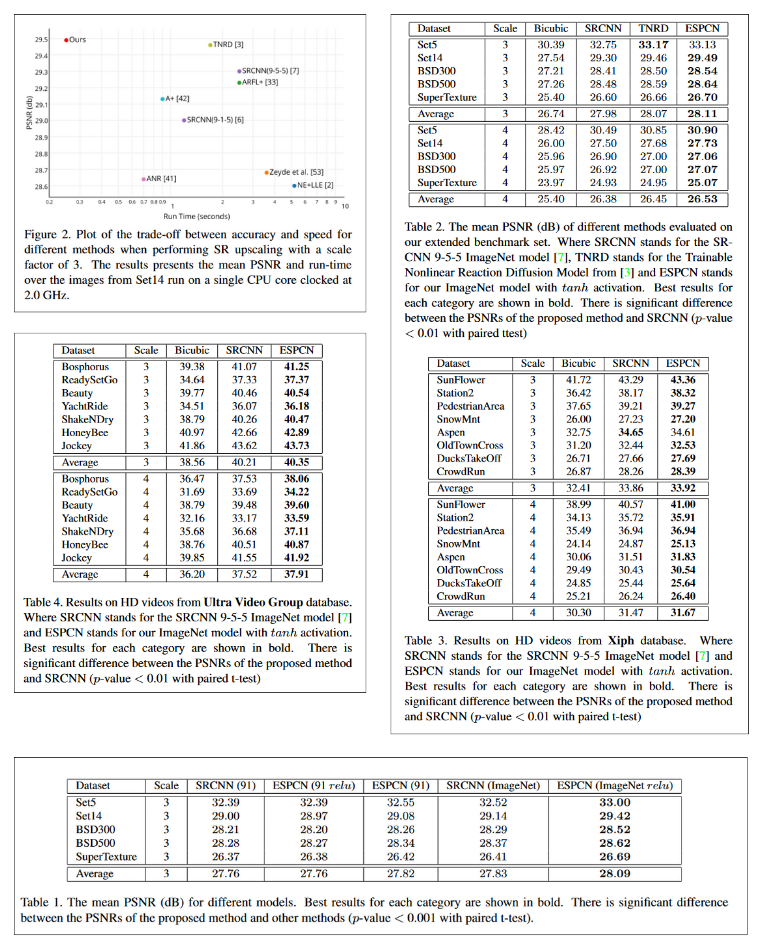
- Plots: Figure 2 is the only plot we have in this paper. It shows the trade-off between speed (x-axis) and accuracy (y-axis) that each models they tested takes. Their model makes the least compromise it seems since it is much faster and has higher accuracy than the rest! Also, the plot is in logarithmic scale making it even more impressive!
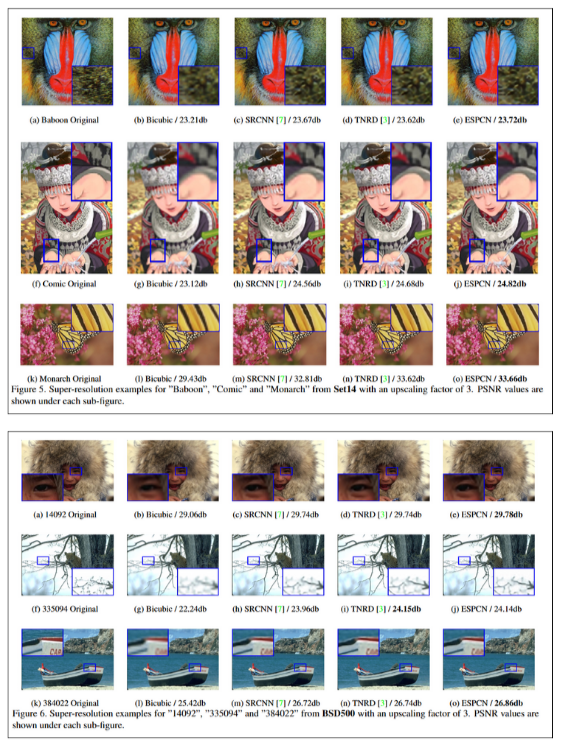
- Image results comparison: Figure 5 and 6 show comparison of super-resolution results from different models, their model and the ground truth. Of course, their model performs the best, even if it can be hard to discern the 2 best models. We can see that the ground is still much more detailed, but these models do an impressive job compared to fixed algorthims such as bicubic interpolation.
Tables
- Benchmarks: All tables, from table 1 to 4, are benchmarks that compare several state-of-the-art models as well as bicubic on different upscaling factors and shows that on both image and video ESPCN (their model) outperforms every other model by a significan margin. Remember that the scale is still logarithmic since this is measuring PSNR, so even a small difference is actually quite significative. We notice that they have chosen a comprehensive enough list of image (Timofte, Set5, Set14, BSD300, BSD500, ImageNet) and video (Xiph, Ultra Video Group) datasets.
Summarize the First Pass
At the beginning it can be a good practice to try and summarize everything to make sure you understood the high level idea of the paper. You can compare this summary to what you actually read in the end and see if you correctly understood the paper.
Here’s a summary of what we detailed previously:
The paper is titled “Real-Time Single Image and Video Super-Resolution Using an Efficient Sub-Pixel Convolutional Neural Network”. They present a new approach to super-resolution that operates efficiently in real-time both on images and videos.
Authored by researchers at Twitter, the model architecture is a Convolutional Neural Network (CNN) to which they add a new layer they introduced called sub-pixel convolution layer to upscale images directly from low-resolution (LR) to high-resolution (HR) space, avoiding the computational inefficiency and bias introduced by traditional upscaling methods like bicubic interpolation. This new method allows the model to process high-definition videos very efficiently with better results in both accuracy and speed.
The benchmarks and comparisons show a lot of improvements in PSNR (Peak Signal-to-Noise Ratio) over existing methods. The figures and tables in the paper provide detailed visual and quantitative analyses that describe the model architecture, learned filter weights, and performance metrics that establishes their model as a leading solution on the single-image super-resolution (SISR) task.
The Second Pass: Introduction and Conclusion
In the second pass, you’ll want to understand the context of the paper as well as get more details on what the paper actually concludes. Sometimes abstracts can state wonders but the paper can turn out to not be as revolutionary as claimed.
The introduction will give a lot more context about the approach and the field and the conclusion should confirm the effectiveness of their approach and state their benchmark results.
The “Introduction”
While diving into the introduction, we want to learn more about the field, even ideally get context of why this is needed. So we want to answer a few questions like: What are the applications of this research? What are we trying to solve? What did researchers in the field try in the past?
Let’s answer a few of these:
What are the applications of this research?
Some people met one day and decided that this was worth gathering a group of talented researchers for and pouring money into. So there must be at least a few uses to it. This means that this is a particularly important task to solve that can benefit at least the company researching it. We need to understand what’s the use of this research and why it’s useful.
Here they interestingly mention “HDTV, medical imaging, satellite imaging, face recognition and surveillance” as applications. They could have mentioned image compression or content sharing on social media for a team from Twitter, a social media, but this passed the review stage so we can assume they might not want to disclose all the usage they have for this technology.
What are we trying to solve?
Understanding the specific challenges and unique aspects of each research task is crucial. When examining a paper, it’s important to identify early on what obstacles the researchers faced and why their work was significant in advancing the field. If you’re considering applying a research paper’s findings to your own project, it’s best to thoroughly explore all aspects of the study to avoid unexpected issues later on. This comprehensive approach helps ensure that you’re well-prepared for any potential challenges when you use their research.
In this case, the paper is tackling the single image super-resolution (SISR) problem. It’s not a simple task because:
- We lose a lot of high-frequency information when we downsample an image. It’s like trying to guess what happened between two frames of a video, there’s information missing!
- There are many possible high-resolution images that could have resulted in the same low-resolution image. It’s like trying to guess what a person looks like from their shadow, there are many possibilities!
- Figuring out which of these possible high-resolution images is the correct one is super tricky.
The researchers are banking on the idea that a lot of the high-frequency stuff in images is actually redundant. So if we’re clever about it, we can reconstruct it from the low-frequency parts we do have. It’s kind of like how your brain can fill in the blanks when you’re reading a sentence with missing letters.
What did researchers in the field try in the past?
Before diving into the details of the paper, it’s good to know what others have tried. It gives us context and helps us understand why this new method might be better. Here’s a quick rundown:
- Multi-image SR methods: These methods use multiple low-res images of the same scene to try and piece together a high-res version. In theory they can reconstruct higher fidelity HR images but you don’t always have multiple shots of a scene and they’re also more computationally heavy.
- Single Image Super-Resolution (SISR) techniques: These are the cool kids on the block. They try to learn the secret sauce of how images work to guess the high-res details from just one low-res image. It’s like being really good at guessing what a zoomed-out picture is showing.
Edge-based methods: These focus on using information provided by edges in the image to determine how we can reconstruct the HR image.
Image statistics-based methods: These use the general rules of how images usually look, or make assumptions on the type of destruction (e.g. blurring, noise, etc) that happened to the image to guide the super-resolution process.
Patch-based methods: These work by using information from HR/LR pairs of patches from many images to help reconstruct the current image.
Sparsity-based techniques: These assume that any image can be broken down into a bunch of simple building blocks. They try to learn what these blocks are and how they fit together.
Neural network-based approaches: These are the new kids on the block, using fancy AI techniques to tackle the problem. They come in all shapes and sizes:
- Stacked auto-encoders (fancy way of saying they compress and decompress the image multiple times)
- Convolutional neural networks (CNNs) (these are really good at understanding images)
- Some other complicated-sounding methods like “multi-stage trainable nonlinear reaction diffusion” and “cascaded sparse coding networks”
And more: Even random forests have been tried.
Each of these methods has its own pros and cons, and researchers are always coming up with new and improved ways to make images sharper and clearer.
The rest of the Introduction
On top of the questions we asked ourselves, they also discuss the motivation of this research in which they mostly summarize what we’ve already said several times: We need to go from LR to HR space at some point and previous work has been doing it either before applying the network (e.g bicubic interpolation) or as the first layer of the network while the authors here propose to do it at the end and work mostly in LR space.
I’ll let you read the rest if you want more details.
The “Conclusion”
The conclusion usually summarizes the paper’s approach and results comparing it to other methods they’ve tested. It’s important to read it to see how their method performed and often they might include a “Future Work” section inside the conclusion or after it to state what are the next possible improvements after their paper.
While reading the conclusion, you should also ask yourself a few questions: What are the main findings? What are the limitations? What future work does the paper suggest?
What are the main findings?
The conclusion is quite short and straight to the point, so we quickly understand that the main findings are that an adaptive scaling layer is much better than a non-adaptive one. Meaning, a scaling method that adapts to the image and each parts of it is better than a fixed algorithm like bicubic interpolation.
The authors mention again that their method works in LR space instead of HR space using their sub-pixel convolution layer. They also compare the method’s computational cost compared to a deconvolution layer and find that at training time their method is faster. Finally, their method is an order of magniture faster ($>10 \times$) and has much better accuracy on both images and videos even compared to CNNs with more parameters, making their method the first usable in real-time on a single GPU.
What are the limitations?
Interestingly, in the conclusion, they don’t mention any limitations but they suggest limitations in the 5. Future Work section, so let’s take a look at it.
They mention that in videos, most static enough scenes contain frames that share content information. This is definitely useful as multiple shots of the same scene can help reconstruct an image better. This implicitely means that their model is limited by the current image only for the reconstruction and can’t use any other information even thought they apply their method on videos. The only benefit for videos with their method is speed.
What future work does the paper suggest?
From the previous section, we understand that the paper suggest that the ability for their model to use information from neighbouring frames would provide it with additional information to help reconstruction. Hence, they will be investigating a spatio-temporal approach of their current model using 3D convolutions, most likely using previous ($n - 1, n - 2, \ldots$) and following ($n + 1, n + 2, \ldots$) frames to help reconstruct better the current ($n$) frame.
Since we’re in the future, it’s easy for us to check that they actually went and released a paper that does just that: “Real-Time Video Super-Resolution with Spatio-Temporal Networks and Motion Compensation” which learns motion estimation based on the previous and next frame and then combines them using 3D convolutions for the joint processing of multiple consecutive video frames.
The Third Pass: Read the Rest of the Article
Now that we’ve got a good overview of the paper from our first two passes, it’s time to dive deeper into the method. This is where we’ll really start to understand how the authors’ approach works and what makes it innovative. Usually you’ll mostly want to focus on the method and understand since you’ve already looked at figures and decided the method seems useful to study.
In this section, we’ll focus on the “2. Method” part of the Pixel Shuffle paper. The “Method” section is the most technical and math-heavy section of a paper in general (sometimes you’ll have “Appendix” sections that can go even deeper in the math details). We’ll break it down step by step.
Problem Formulation
Let’s start by understanding how the authors formulate the super-resolution problem:
- We have a High Resolution (HR) image $I^{HR}$ and a Low Resolution (LR) image $I^{LR}$.
- The goal is to estimate $I^{SR}$ (the final Super Resolution image) from $I^{LR}$.
- $I^{LR}$ is created by applying a Gaussian filter to $I^{HR}$ and then downsampling it by a factor of $r$.
This formulation is important because it defines the task: We’re trying to reverse the process of downsampling and blurring to recover a possible high-resolution image.
The ESPCN (Efficient Sub-Pixel Convolutional Neural Network) Architecture
The authors introduce their Efficient Sub-Pixel Convolutional Neural Network (ESPCN). Let’s break it down into its components:
Convolutional Layers: The network starts with $l$ convolutional layers applied directly to the LR image $I^{LR}$. This is different from previous approaches that would first upscale the image.
Feature Extraction in LR Space: By working in the low-resolution space, the network can be more efficient. It’s processing fewer pixels for most of its operations.
Sub-Pixel Convolution Layer: This is the key innovation. Instead of upscaling early, they introduce a special layer at the end to efficiently upscale the feature maps to high resolution.
Let’s look at how they describe the layers mathematically:
For the first $L-1$ layers:
- $f^1(I^{LR}; W_1, b_1) = \phi(W_1 * I^{LR} + b_1)$: This just means that for the first layer, we apply a linear layer with a bias and an activation
- $f^l(I^{LR}; W_{1:l}, b_{1:l}) = \phi(W_l * f^{l-1}(I^{LR}) + b_l)$: This means that for all layers after, the next one takes the previous layer as input and applies a linear layer with bias and an activation. Pretty classic. pixel_shuffle_paper_method_p5.png
Where:
- $W_l$ and $b_l$ are the weights and biases for layer $l$
- $\phi$ is the activation function (they use $tanh$)
- $*$ is the convolution operation
The final layer (the sub-pixel convolution layer) is defined as:
$I^{SR} = f^L(I^{LR}) = PS(W_L * f^{L-1}(I^{LR}) + b_L)$
Where $PS$ is the pixel shuffle operation, which we’ll explain next.
The Sub-Pixel Convolution Layer
This is where the magic happens! The sub-pixel convolution layer is what allows the network to efficiently upscale the image at the end of the process. Here’s how it works:
The last convolutional layer produces feature maps with $r^2C$ channels, where $r$ is the upscaling factor and $C$ is the number of color channels in the output image. If you need even more details, [(re-)read the section on Super Resolution of practical work 2 on Convolutional Neural Networks (CNNs).
The pixel shuffle operation ($PS$) then rearranges these feature maps into the final high-resolution image.
Mathematically, the pixel shuffle operation is defined as:
$ PS(T)_{x,y,c} = T _{\lfloor x/r \rfloor, \lfloor y/r \rfloor, C \cdot r \cdot \text{mod}(y,r) + C \cdot \text{mod}(x,r) + c} $
This might look complicated, but it’s essentially just reshaping the tensor. It’s taking groups of $r^2$ values from the feature maps and arranging them into $r \times r$ blocks in the output image.
The beauty of this approach is that it allows the network to learn the upscaling filters directly, rather than using a fixed upscaling method like bicubic interpolation. This means the upscaling can be adaptive to different types of image content.
Let’s decompose it a bit further:
Input and Output
- $T$ is the input tensor (the feature maps from the last convolutional layer)
- $PS(T)$ is the output tensor (the high-resolution image)
- $x$, $y$, and $c$ are the coordinates and channel in the output image
- $r$ is the upscaling factor (e.g., 2 for 2x upscaling, 3 for 3x upscaling)
- $C$ is the number of channels in the output image (typically $3$ for RGB or $1$ if using a YCbCr luminance decomposition)
Spatial Mapping
The first two terms in the right-hand side, $\lfloor x/r \rfloor$ and $\lfloor y/r \rfloor$, map the output coordinates to the input coordinates:
- $\lfloor x/r \rfloor$ maps the x-coordinate from the HR space to the LR space
- $\lfloor y/r \rfloor$ maps the y-coordinate from the HR space to the LR space
When we say “$\lfloor x/r \rfloor$ maps the x-coordinate from the HR space to the LR space”, we’re describing how we find the corresponding position in the low-resolution (LR) input for each position in the high-resolution (HR) output. Let’s dive deeper:
Coordinate Systems:
- In the HR output, x ranges from 0 to (rW - 1), where W is the width of the LR input.
- In the LR input, x ranges from 0 to (W - 1).
The Division:
- $x/r$ scales down the HR coordinate by a factor of r.
- For example, if $r = 2$, then HR coordinates 0 and 1 both map to 0/2 = 0 in LR space, HR coordinates 2 and 3 both map to 1 in LR space, and so on.
The Floor Function:
- $\lfloor x \rfloor$ (floor function) rounds down to the nearest integer.
- This ensures we always get a valid integer coordinate in the LR space.
Let’s look at a concrete example with $r = 2$ (2x upscaling):
HR x:  0  1  2  3  4  5  6  7
       |  |  |  |  |  |  |  |
       v  v  v  v  v  v  v  v
LR x:  0     1     2     3
- For HR $x = 0$ or $1$: $\lfloor 0/2 \rfloor = \lfloor 1/2 \rfloor = 0$ in LR
- For HR $x = 2$ or $3$: $\lfloor 2/2 \rfloor = \lfloor 3/2 \rfloor = 1$ in LR
- For HR $x = 4$ or $5$: $\lfloor 4/2 \rfloor = \lfloor 5/2 \rfloor = 2$ in LR
- And so on…
This mapping is crucial because it tells us which pixel in the LR input corresponds to each 2x2 block in the HR output. The network has learned to pack the information for each of these 2x2 HR blocks into the channels of a single LR pixel.
By using this mapping, the pixel shuffle operation knows exactly where in the LR input to find the information for each HR output pixel. This is what allows the network to efficiently upscale the image while working primarily in LR space.
It’s crucial to understand the idea that this mapping is what makes the pixel shuffle operation achieves such good results in super-resolution tasks.
Channel Mapping
The last part of the formula, $C \cdot r \cdot \text{mod}(y,r) + C \cdot \text{mod}(x,r) + c$, is responsible for selecting the correct channel from the input tensor. Let’s break it down further:
- $\text{mod}(y,r)$ gives the y-offset within each $r \times r$ block
- $\text{mod}(x,r)$ gives the x-offset within each $r \times r$ block
- $C \cdot r \cdot \text{mod}(y,r)$ selects the correct row of channels
- $C \cdot \text{mod}(x,r)$ selects the correct column of channels
- $c$ selects the specific channel within the selected group
Training the Network
The authors train their network using mean squared error (MSE) as the loss function:
$\ell(W _{1:L}, b _{1:L}) = \frac{1}{r^2HW} \sum _{x=1}^{rH} \sum _{y=1}^{rW} (I^{HR} _{x,y} - f^L _{x,y}(I^{LR}))^2$
We might question: Were there any better choices of loss function?
Many other approaches like perceptual losses that enable using features from pretrained models or Structural Similarity Index (SSIM) to compare higher level features of the images instead of pixels like MSE would.
However, let’s remember that at this time, such losses were not common practice and not yet as developed as today. Furthermore, they use Peak Signal-to-Noise Ratio (PSNR) as a metric to judge image quality and it turns out: MSE is a direct optimizer to PSNR!
The formula of PSNR is the following:
$PSNR = 10 \cdot \log_{10} \left(\frac{MAX_I^2}{MSE}\right)$
It includes MSE inside it! Meaning that PSNR is a monotonically decreasing function of MSE, so the loss is directly optimizing the metric we are using to judge our model quality.
So, for all these reasons they used MSE at the time but it’s always a good idea to question and ask why a particular metric (or anything else) was being used instead of another. It’s not because that this is a paper that it is perfect.
Remember: Doing research is to question everything!
The rest
We’ve finally got a good understanding of the method, we can build the network architecture and train the model. What’s left to look at is to see their actual Experiments: What datasets they’ve used, how other methods they’ve tried score, and more specific implementation details (e.g. hyperparameters used).
Usually this part is much simpler to understand if you’ve understood the method since you know what is needed to make the approach function. We won’t dive too deep in this section since we’ve already mentioned the tables and plots previously.
It’s also the part that you’ll come back to several times while you are implementing the paper and trying to either reproduce their results or find the best hyperparameters for your own use case. In this paper, we can find these details in 3.2. Implementation details.
Finally, take some time to read the results on all their datasets, you might spot strengths and weaknesses of their model that they won’t always explicitly mention.
Fourth Pass: Reread and Focus on Parts You Didn’t Understand
This last part is simply going back to the method, trying to see if you’re still missing anything, if there are still questions. Any question that’s left, should guide your rereading of the paper, because you want to find an answer to this question. Sometimes, for established papers, you can find external content like blog posts or even videos of people trying to explain the context in an easier way. However, that’s not always possible if the paper is too recent.
On top of that, if you’re struggling on more fundamental concepts, let’s say you forgot specific rules of calculus, you’ll have to look into learning those concepts before pursuing the paper, otherwise you’ll get confused and won’t be able to advance and understand how a particular formula came to be or why it works.
Finally, it’s also possible to ask questions to people around you, for example, if you’re studying a paper with a group of peoplem, it can be beneficial to discuss the paper together and that each person explains it their way. It might be able to shed light if someone understood something differently or has figured out a different, maybe easier, intuition to the problem.
It’s Your Turn!
Now you should be ready to tackle another paper. This article gave you some tools and you need to try them out yourself on a different paper and see how this methodology can help you better go through research. You won’t become an expert after only reading one paper: It takes a while to learn all the reflexes and why they make sense!
Exercise: Paper Report
Read one of the papers cited in this article and take notes. On top of that, you’ll have to explain the order in which you read the paper and your thought process, things you didn’t understand, the research you did externally to the paper (Google searches, reading other papers, articles, blogs, etc), what confused you, etc.
You’ll have to choose one of the papers that were cited throughout this article (except the Pixel Shuffle paper obviously), so there’s plenty of choice. If you want to dive into a specific paper that isn’t cited here, please send it to me so I can approve it.
You’ll be sending a written report as your practical work!
Follow a similar analysis to what we did above as your report structure. You can send me a PDF, a Google Doc or anything that’s relevant. Please do not send a simple unformatted (e.g. .txt) file.
You’re Done!
Great job, you made it this far!
Class Students
Send it on the associated MS Teams Assignment.
Anyone else
Send it to my email adress with the subject Practical Work 4: chady1.dimachkie@epita.fr
Don’t hesitate if you have any questions!